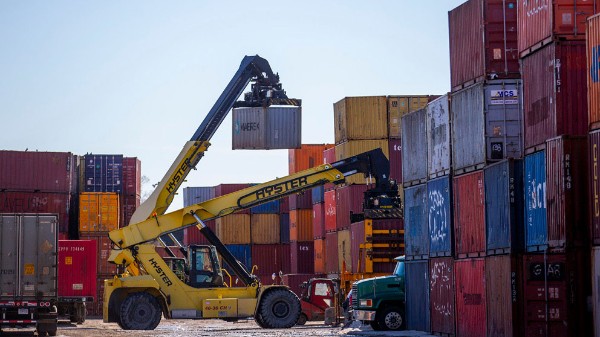
Trade with the U.S. provides a safe harbour during the pandemic

ShippingDockLift

On the occasion of the U.K. joining the Comprehensive and Progressive Trans-Pacific Partnership(CPTPP), we’re looking at Canadian export performance in key trading blocs with whom we have agreements

    by Martha Roberts – Farm Credit Canada (FCC) 

The CPTPP welcomes Britain alongside 11 founding members, including Australia, Brunei, Canada, Chile, Japan, Malaysia, Mexico, Peru, New Zealand, Singapore, and Vietnam. It’s one of several multilateral agreements that allow Canadian exporters preferential access to major markets.

The Comprehensive Economic and Trade Agreement (CETA) with the European Union is the other major bloc selected here, and both are compared to our export performance over the last 10 years of trade with the U.S., China and the U.K.

 
 “Diversification away from the U.S. is good risk management for Canada’s food sectors and individual businesses”


The CPTPP: What have you done for me lately?

Trade agreements such as the CPTPP ease the normal export costs to foreign markets. Tariffs, a kind of tax applied at borders, drive up the cost of the exported good, making it less competitive with domestically produced substitutes in the foreign retail markets. Agreements eliminate many, if not most, tariffs, which the CPTPP did for a region comprising the world’s leading economic growth region – the motivation behind the years of work necessary to get to the point of ratification. It’s an important region for our exporters: Of all current members, Japan, Mexico and Vietnam are Canada’s largest markets for several food products.

However, in the four years and two months since the agreement became active, the benefit to Canadian exports of agricultural commodities and food products to the region has wavered (Figure 1). Compared to the five years before the agreement, Canada’s food trade appears as susceptible to volatility, as shown in the average annual growth (AAG) rate over the 9 years. The agreement seems to have made a difference immediately following ratification, although that trend quickly ended when the global pandemic struck. The AAG rate for 2014 – 2018 was 3.5% compared to the 2.8% rate between 2019 and 2022.

Figure 1: The before and after stories of the CPTPP: big swings characterize both periods

Chart showing the average annual growth of Canada’s food exports to CPTPP countries between 2014 and 2022.Source: Canadian International Merchandise Trade

CETA: ratified European export markets may yet offer greater benefit

The volatility that characterizes our export performance under the CPTPP is like the swings visible in the periods directly before and after CETA came into force (Figure 2). The introduction of this agreement has helped smooth out the swings somewhat, although it’s difficult to measure the exact benefits outright.

Of the 27 individual countries signed to CETA, 17 have ratified the agreement. But ratification status hasn’t made much difference to the pace of growth of EU imports to date. In both cases, the period post-enforcement featured slowed AAG rates. Unratified markets had a rate of 13.3% each year before and a rate of 9.4% after. Ratified markets had a rate of 9.8% each year before the agreement came into force and 7.9% each year after.

Figure 2: Ratification amplifies growth trends

Chart showing the average annual growth of Canada’s food exports to CETA-ratified and unratified countries between 2013 and 2022.Source: Canadian International Merchandise Trade

However, the two periods are hard to compare as the pandemic also took a bite out of Canadian exports of agricultural commodities and food products here. But, unlike with CPTPP countries, the big nosedive noticeable in 2020 reversed in 2021, with both ratified and unratified countries increasing their imports year-over-year (YoY). We’ll see at the end of this year if the trend from 2022’s faster growth of ratified countries continues. It’s hardly guaranteed. The Russia-Ukraine war has caused upheaval in commodity markets and supply chains and has helped to realign trade partners along emerging or strengthened geopolitical lines.

What to expect from the U.K.

The U.S. remains Canada’s largest and most important export market. The strength and history of the relationship between the two countries is evident in the relative stability of our exports there over the same 10-year period (2013 – 2022) (Figure 3). The introduction of the Canada-U.S.-Mexico Agreement (CUSMA) in July 2020 updated the 26-year-old North American Free Trade Agreement (NAFTA) with terms and mechanisms more suited to the current global trade landscape. It, too, had an immediate effect, but unlike the CPTPP and CETA, it was brought into force during the pandemic. Underscoring the value of our U.S. trade relations, Canada’s AAG of food exports to the U.S. was 2.7% in 2018 and 2019 and 14.5% in 2021 and 2022.

Figure 3: U.S. trade brings stability to Canadian agrifood exports

Chart showing the average annual growth of Canada’s food exports to the U.S., U.K. and China between 2013 and 2022.Source: Canadian International Merchandise Trade
Our exports to China are a study in contrast. Between 2013 and 2018, Canadian export growth climbed at an AAG rate of 17.1%. In 2018, diplomatic tensions led to a Chinese boycott of some of Canada’s exports, a trend that was then reversed in 2019 only to be cut short by the pandemic. The U.K. also shows volatility in the AAG rate and the same dampening effect of the pandemic, which lasted to the end of 2022. But their growth in imports of Canadian agricultural commodities and food products continues to be positive.

Bottom line

Diversification away from the U.S. is good risk management for Canada’s food sectors and individual businesses. While that won’t be easy, the availability of numerous trade agreements with other key markets will help. However, in our trade with major trading blocs, the disruption of the pandemic continues to be felt, with non-U.S. markets showing a great deal more volatility in their imports of Canadian goods both before the agreements came into effect and after. We have yet to determine if that’s a feature of 2023 markets or when it may end.

Martha Roberts joined FCC’s Economics team in 2013, focusing on research insights about risk and success factors for agricultural producers and agri-businesses


Posted in

Our December 2024 Issue

In our December 2024 issue we look at the Indonesia Economic Partnership Agreement, Federal funding for the Cattle Industry’s Improvement initiatives, Ontario’s Agritourism Sector, Cargill cutting jobs, A&W tackling food waste, Consumer Trust over Climate Optics, the rising cost of doing business, and much more!


Screen Shot 2020-08-19 at 11.51.13 PM

Leave a Comment

You must be logged in to post a comment.